
(Classification) What determine the level of alcohol consumption in each country?
0. Alcohol Consumption by Country
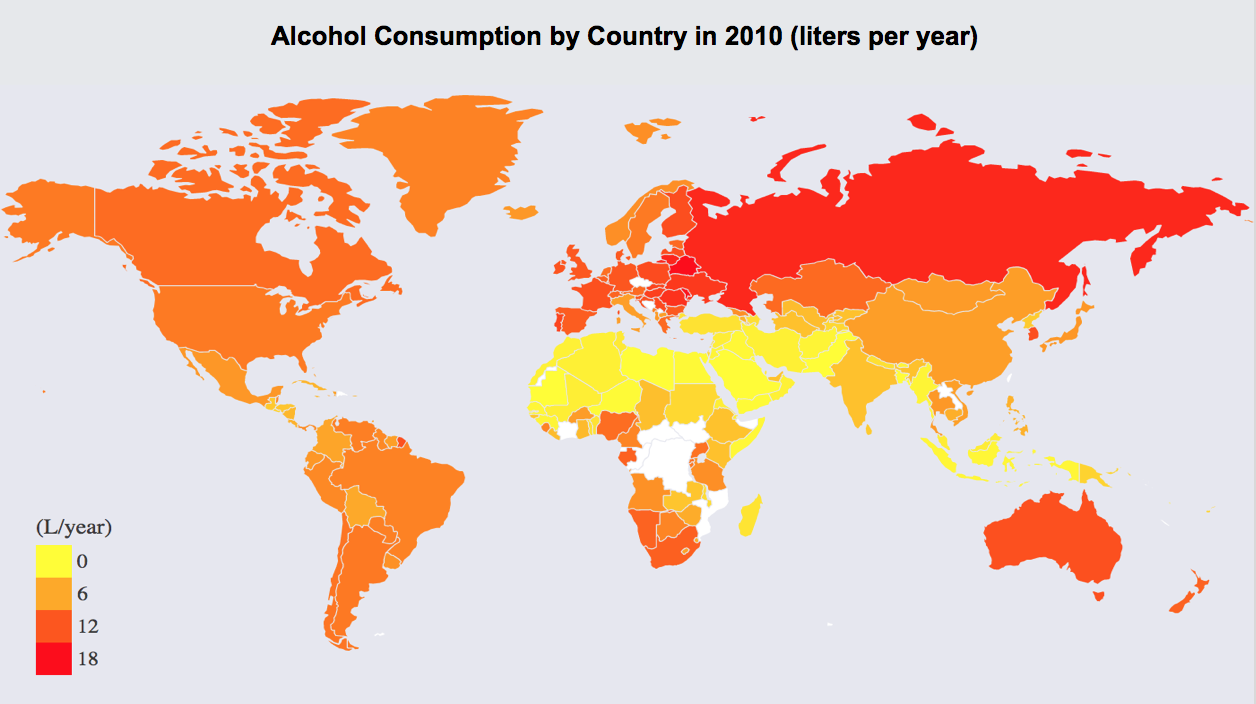
1. Project Objective
1-0. Part I
Classifying alcohol consumption into three categories
- heavy drinking: > 11 liters/year
- moderate drinking: 9 ~ 11 liters/year
- light drinking: < 9 liters/year
1-1. Part II
Classifying change in alcohol consumption into three categories
- + (positive): consumption increased this year
- - (negative): consumption decreased this year
- = (constant): consumption unchanged this year
2. Data Structure
- Data source: OECD (OECD Data)
- 34 countries from 1990 to 2017
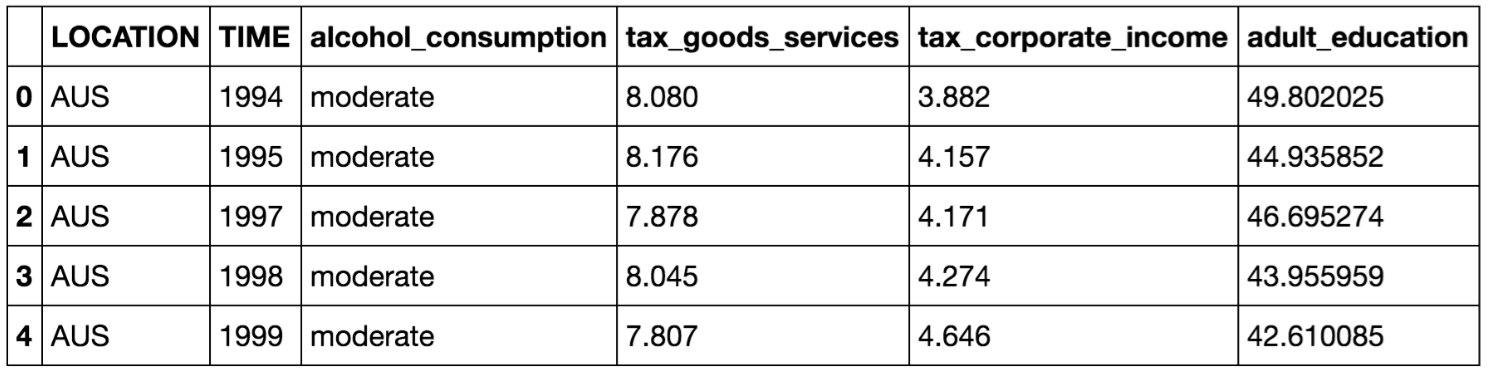
2-0. Part I
Y (dependent variable): alcohol consumption
X (independent variables): 29 features (tax on goods, corporate tax, unemployment rate, average wage, …)
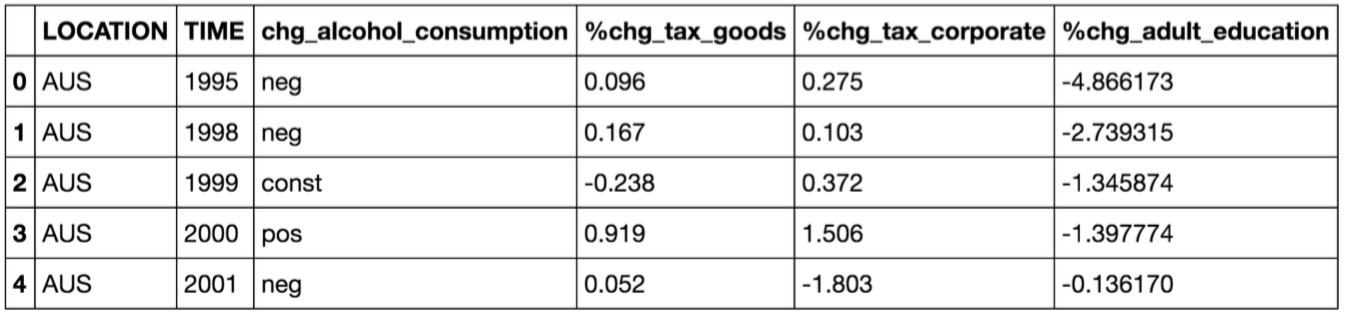
2-1. Part II
Y (dependent variable): change in alcohol consumption
X (independent variables): % change of 29 features (%chg tax on goods, %chg corporate tax, %chg unemployment rate, %chg average wage, …)
3. Analysis
3-0. Part I: What determine alcohol consumption?
- Linear Regression on Alcohol Consumption
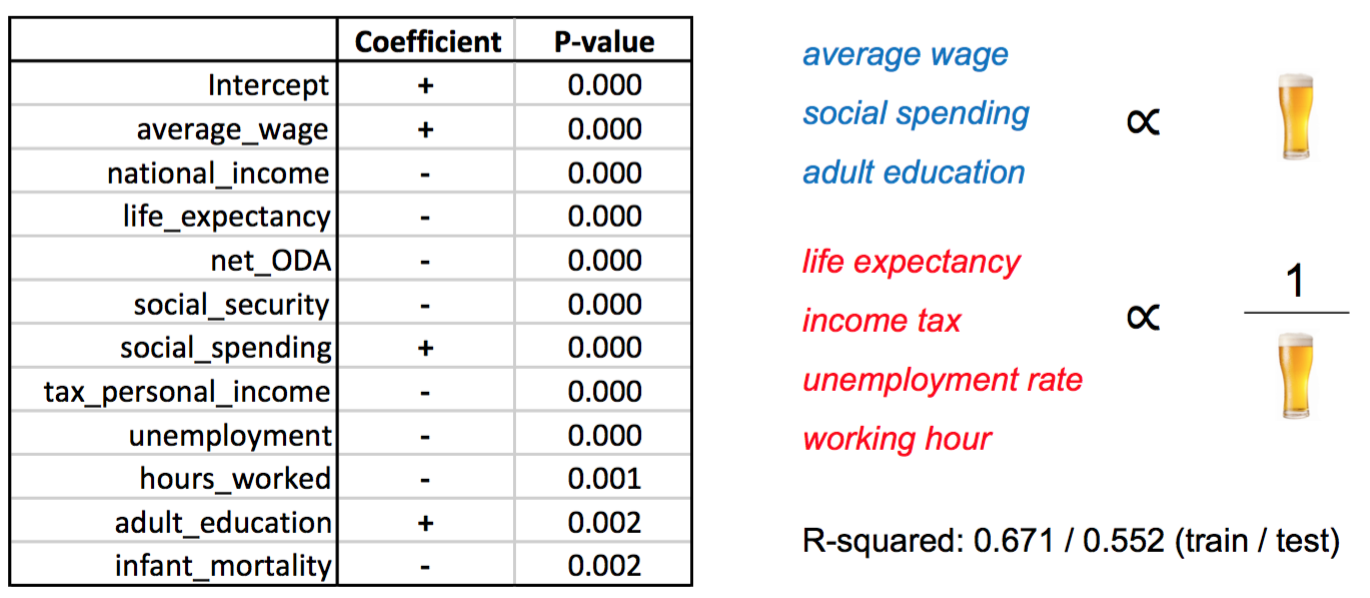
The above table represents all features that have significant statistical significance. Average wage, social spending, and adult education have positive correlation with alcohol consumption. This is becuase if the average worker earns more money, then they are more likely to afford alcohol during their spare time. On the contrary, life expectancy, unemployment rate, and hours worked are negatively correlated with alcohol consumption. It is hard to identify the causal relationship between life expectancy and alcohol consumption because people who consume more alcohol may have less life expectancy. In addition, countries with low unemployment rate and less hours have relatively higher alcohol consumption according to the result. R-squared of the training set is 0.671 while the test set has 0.552 R-squared.
Then, in order to find the optimal model for classification, I conducted grid search on KNN, Logistic Regression, Support Vector Machine, and Random Forest as follow.
- Grid Search
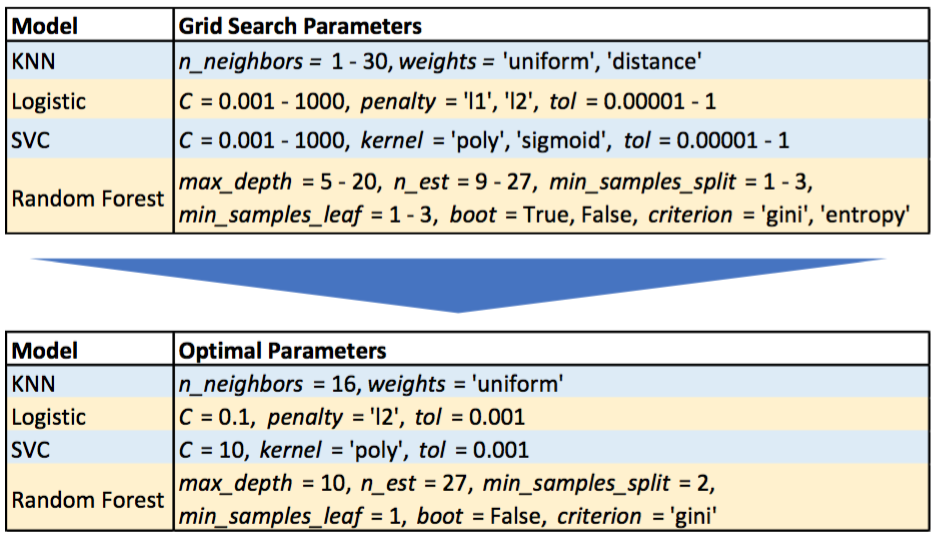
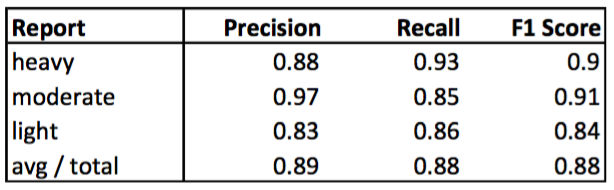
It turned out that Random Forest beat all the other models in classification measures including precision, recall, and F1 score. The precision and recall for the model is around 90%.
- Random Forest Classification Report
- Linear Regression VS Random Forest in Feature Importance
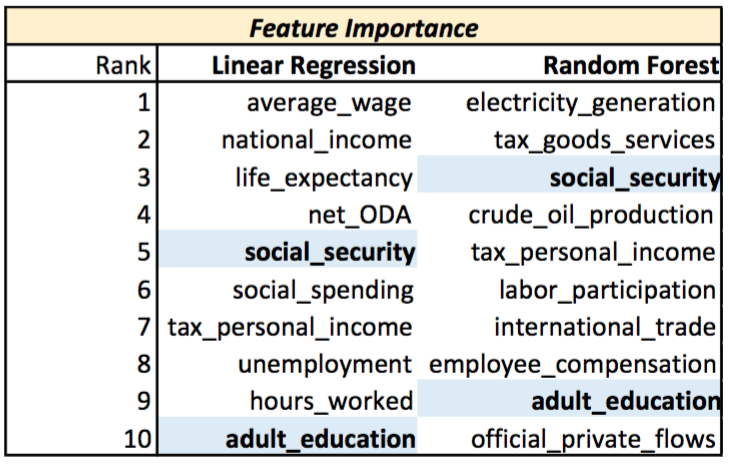
There are differences between linear regression and random forest in terms of feature importance. The above table shows top 10 major features for each model, and it turned out that there are only two common features. In the Random Forest model, electricity generation is the most important feature while it is not significant in the linear regression model. Spending on social security and the percentage of adult education in each country turned out to be significant factors in determining alcohol consumption.
3-1. Part II: How do changes in features affect alcohol consumption change?
- Linear Regression on Alcohol Consumption change
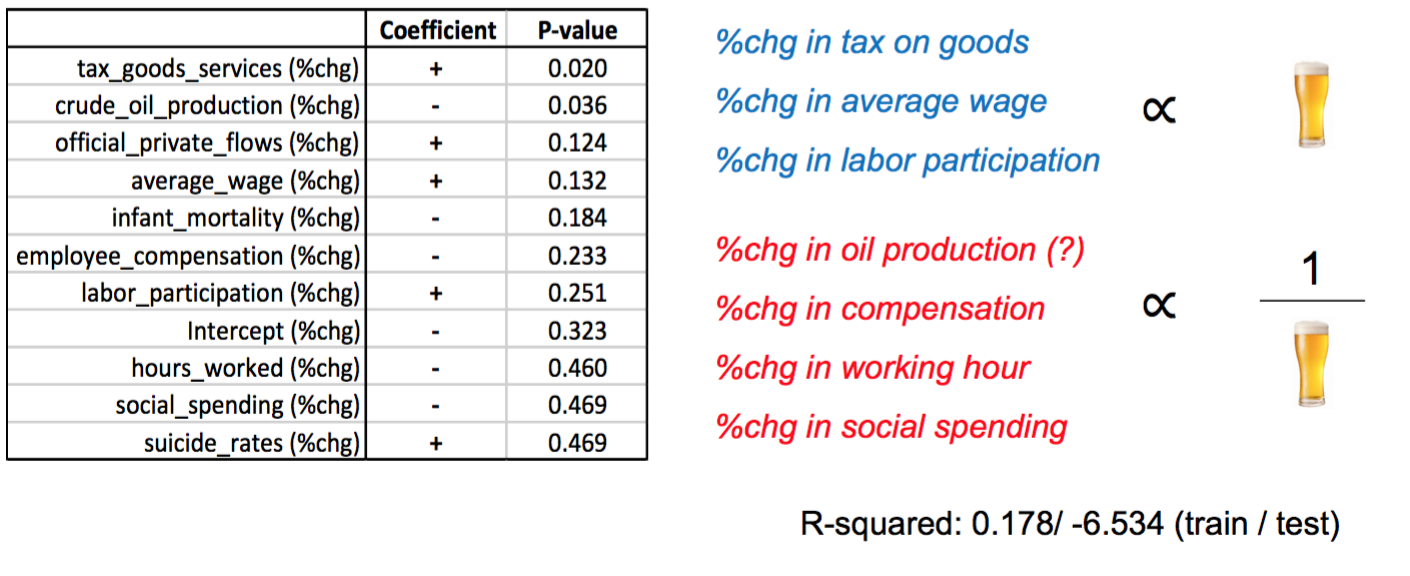
The above table represents all features that have significant statistical significance. R-squared of the training set is 0.178 while the test set has -6.534 R-squared. This indicates that the linear regression does not explain the alcohol consumption change with given models. We will look at how classification model works to predict alcohol consumption change.
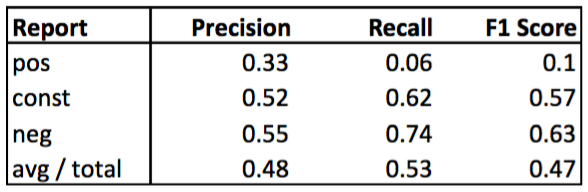
In order to find the optimal model for classification, I conducted grid search on KNN, Logistic Regression, Support Vector Machine, and Random Forest as part I. Random Forest exhibited the best result among these models, however, the precision and recall went down significantly from 90% to 50%.
- Random Forest Classification Report
4. Conclusion
Based on the analysis conducted in the part I, adult education, average wage, and social spending were found to be positively correlated with alcohol consumption. If a person is more educated, then the person is more likely to earn higher wage and this can result in higher alcohol consumption. On the contrary, income tax and unemployment rate are negatively correlated with the consumption because higher income tax and unemployment rate tend to decrease the demand of drinks. Predicting YoY change in alcohol consumption with existing features is relatively harder than predicting the consumption itself because the existing features do not consider accumulated effects. Another interesting finding is that tax on goods and services played a significant role in both regression and classification models, which implies that the government could levearge this element to regulate alcohol consumption.