
(Data Cleaning) How should we allocate our advertisement team into NYC subway stations?
0. Project Motivation
This project was designed to improve data acquisition, data manipulation, data visualization, and data analysis skills with Python.
1. Project Description
Our client, WomenTechWomenYes (WTWY) has an annual gala at the beginning of the summer each year. As WTWY is a new and vibrant organization, they want to fill the event with people passionate about increasing the participation of women in technology. They want us to optimize the placement of the street team so that they can gather the most signatures, especially who are willing to attend and donate to the organization.
2. Data
| Data Source | Reason |
|---|---|
| MTA Turnstile Traffic | Determine busiest stations |
| Station GPS Location | Find a zipcode for each station |
| NYC Tax Declaration | Find financially empowered districts |
| Google/Bingle Maps | Complement missing GPS data |
3. Analysis
3-0. Data Cleaning
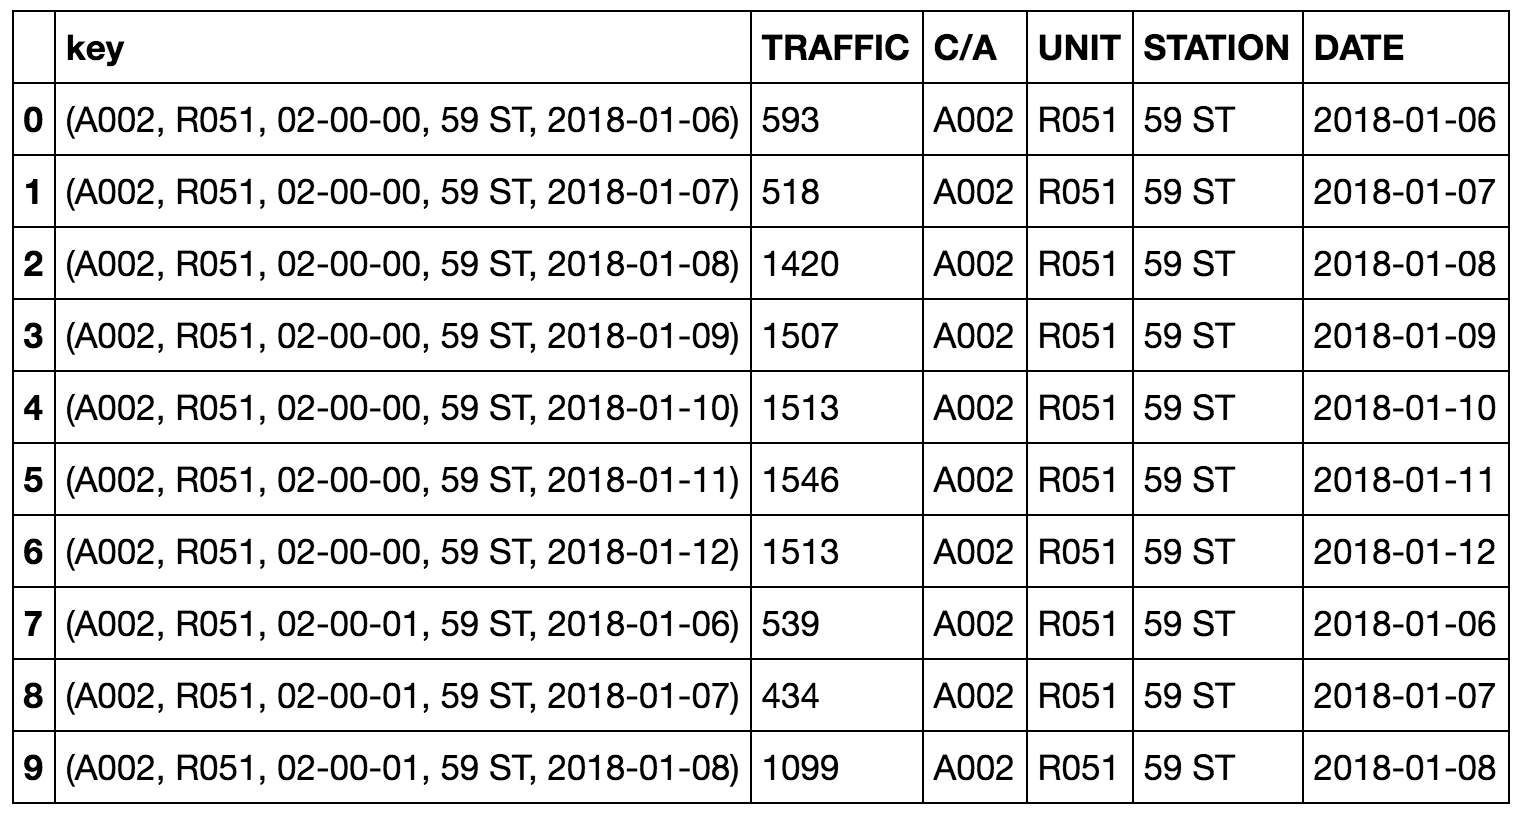
I acquired MTA turnstile data from MTA turnstile info . I then grouped the data by the station, day, and time period and added turnstile traffic to derive the total traffic. The previous dataframe and the merged dataframe are as follow.
[Before: Turnstile Traffic]
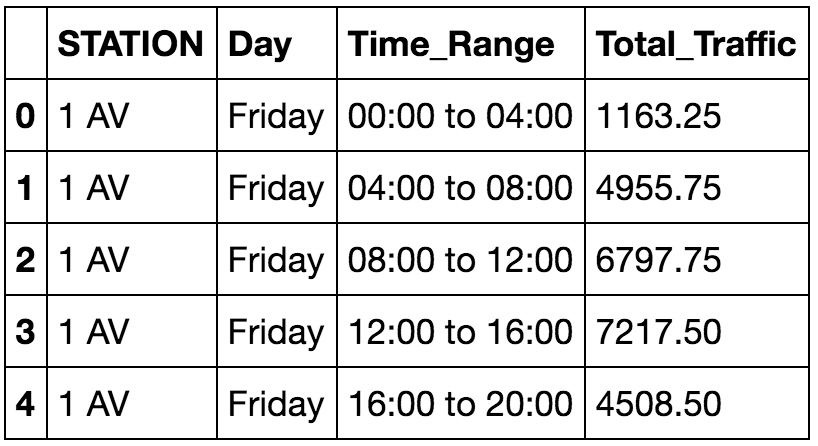
[After: Total Traffic]
3-1. Analysis
The following graph shows the busiest station for different time periods throughout the week.
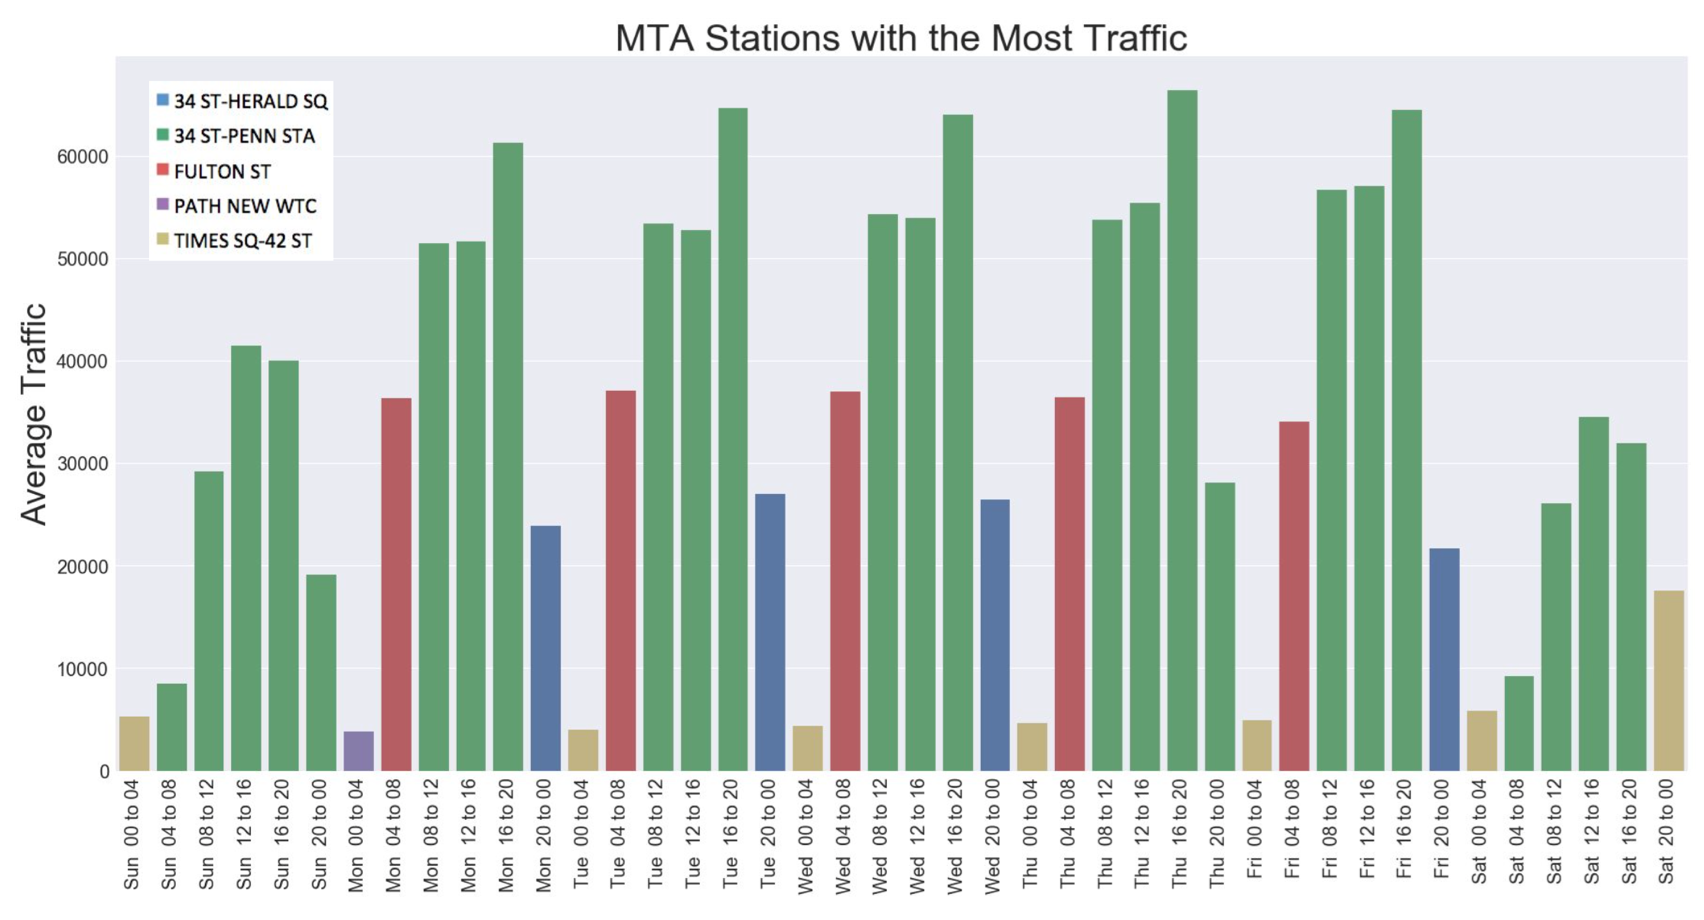
As expected, weekday traffic is higher than weekend traffic and the number of subway passengers goes up rapidly around the morning rush hour. Penn Station on the 34th street turned out to be the busiest station in New York City for most time periods. In order to see more detail of the specific time period, I plotted top 12 busiest stations from 4 PM to 8 PM on Thursday.
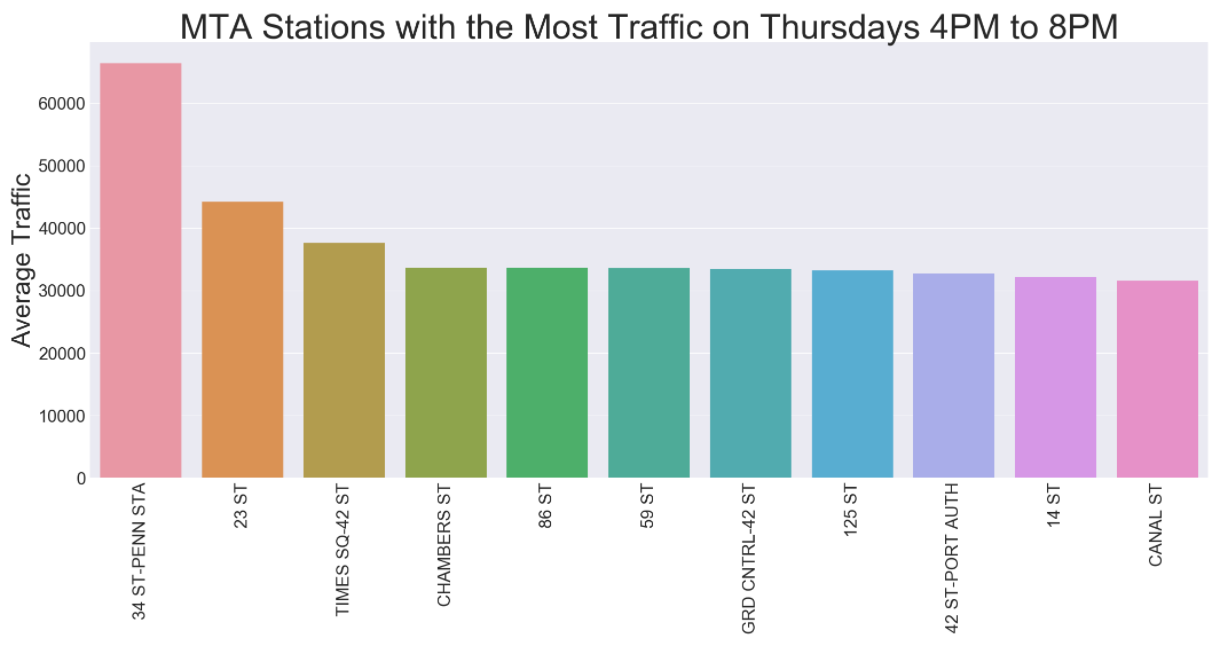
The Penn station turned out to be the busiest station during this time and it is followed by the 23rd and Times Square stations. However, the penn station is one of the largest stations in New York City and it is not a good idea to promote the event in all entrances. In order to consider the size of each station, I divided the traffic by the number of entrances as follow.
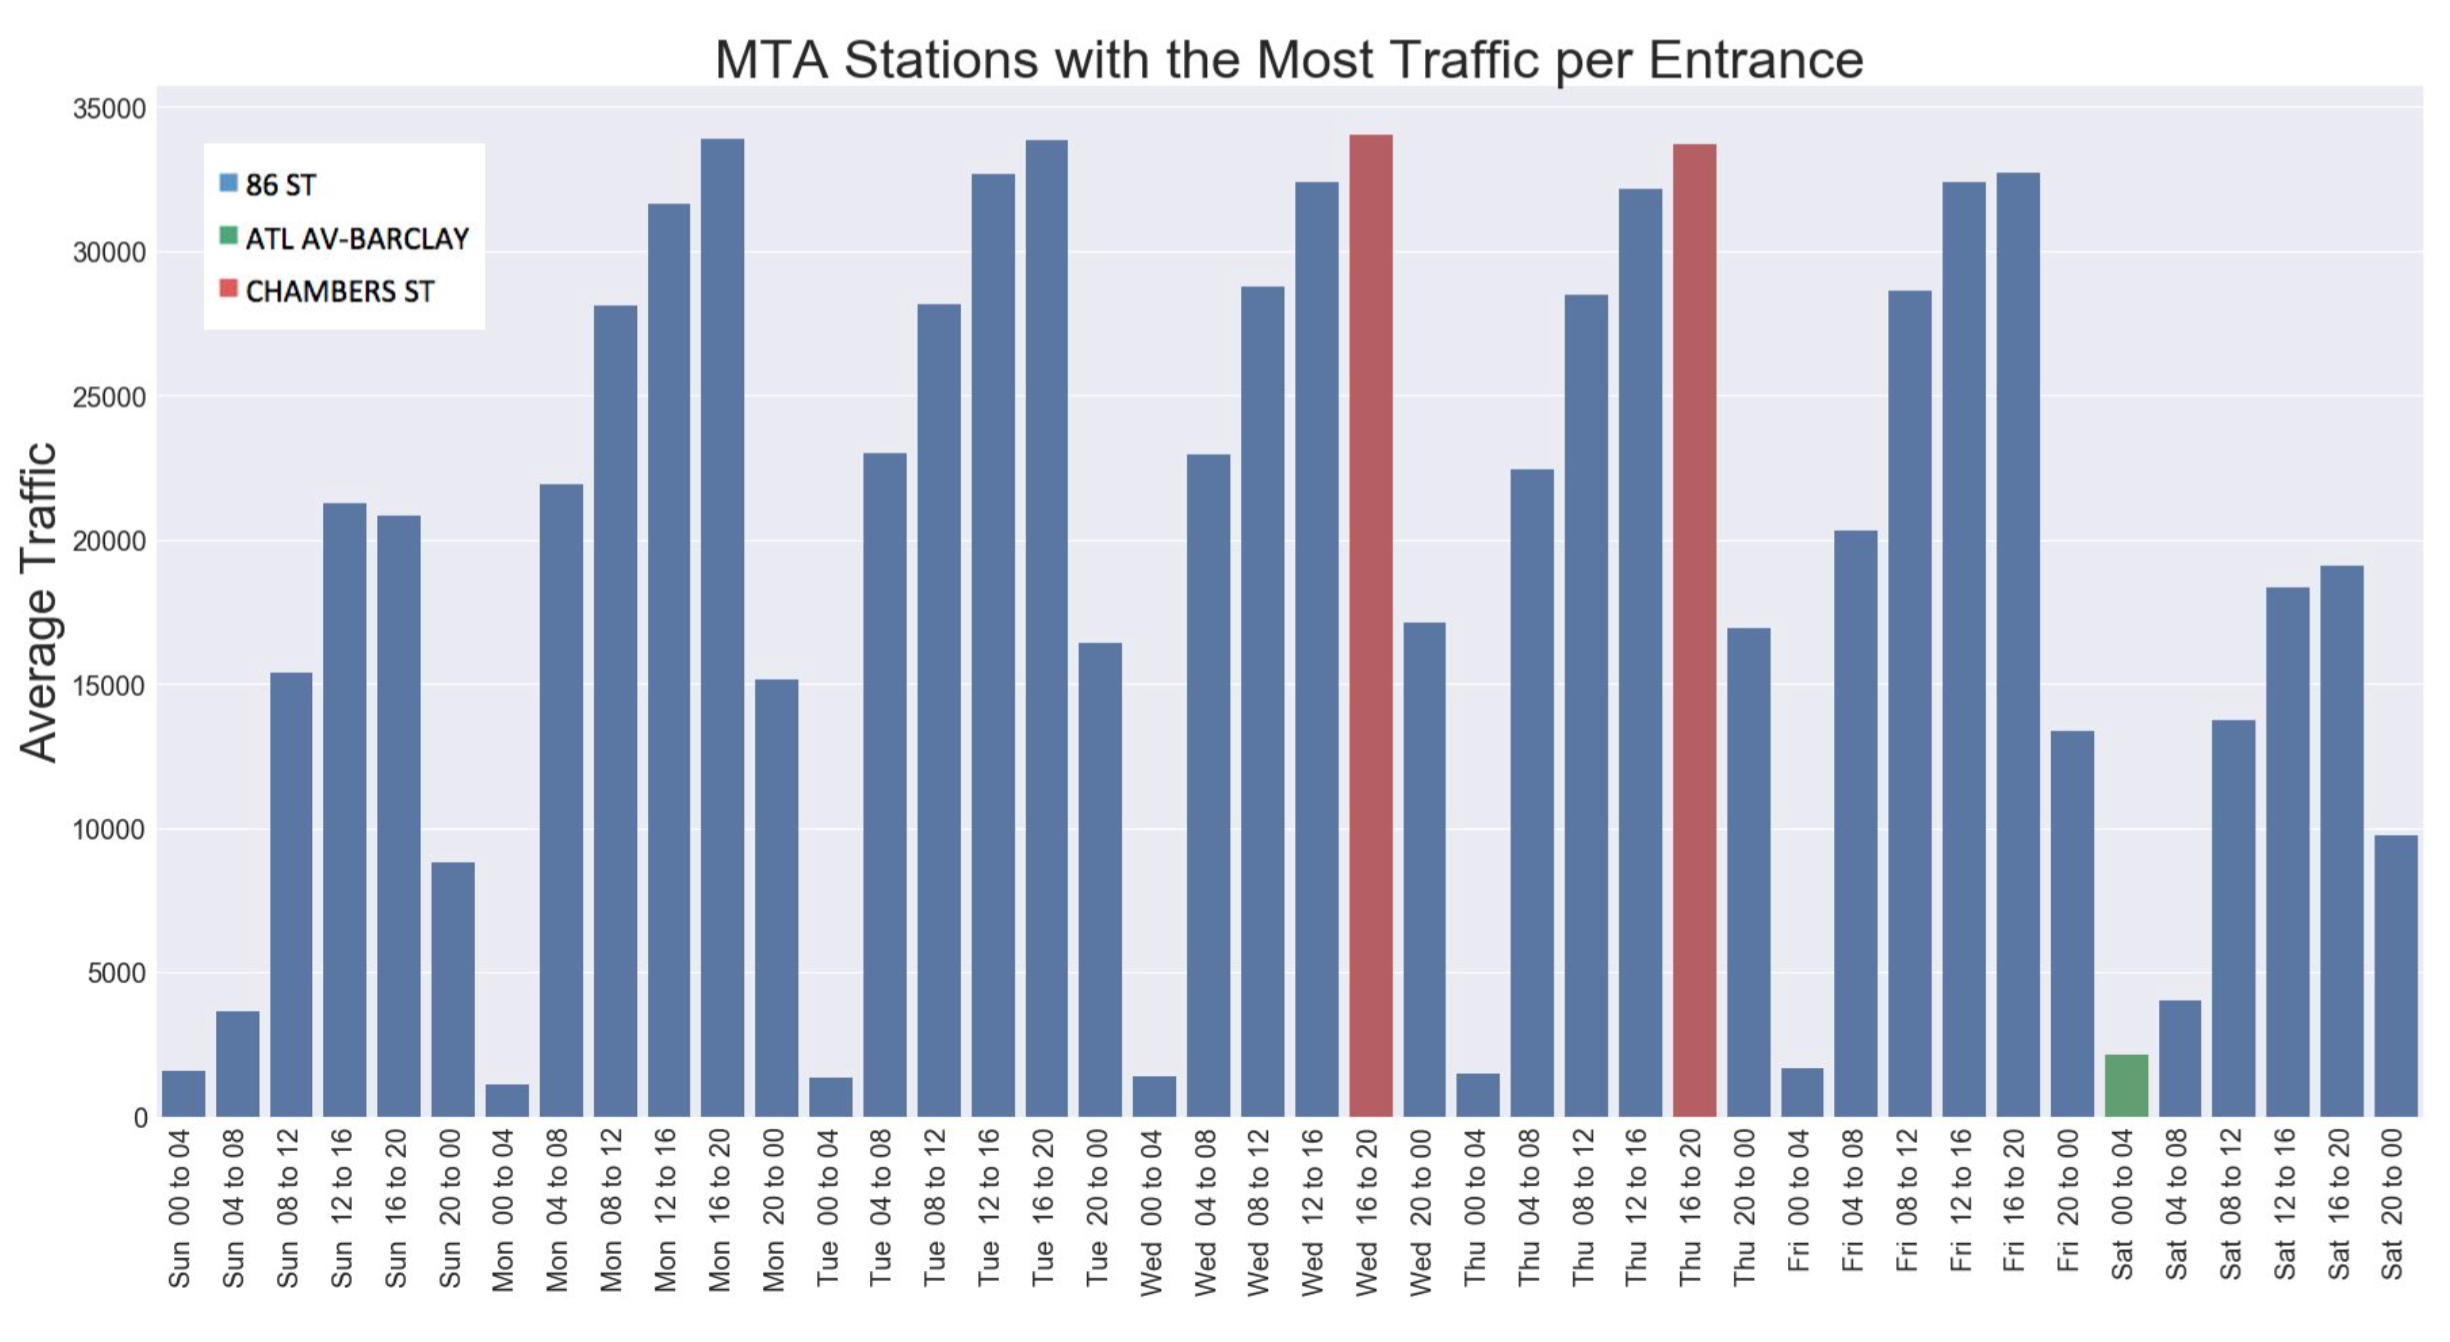
Now, the penn station is not the busiest anymore and the 86th street station at the upper east side has the most traffic per station. This is because the penn station has 16 entrances while the 86th station has only one entrance.
Next, I will merge the previous data with the income distribution data by matching GPS coordinates and zip codes. Prior to combining the two data, I calculated the weighted mean income by zip codes in order to identify the areas with more potential donators.
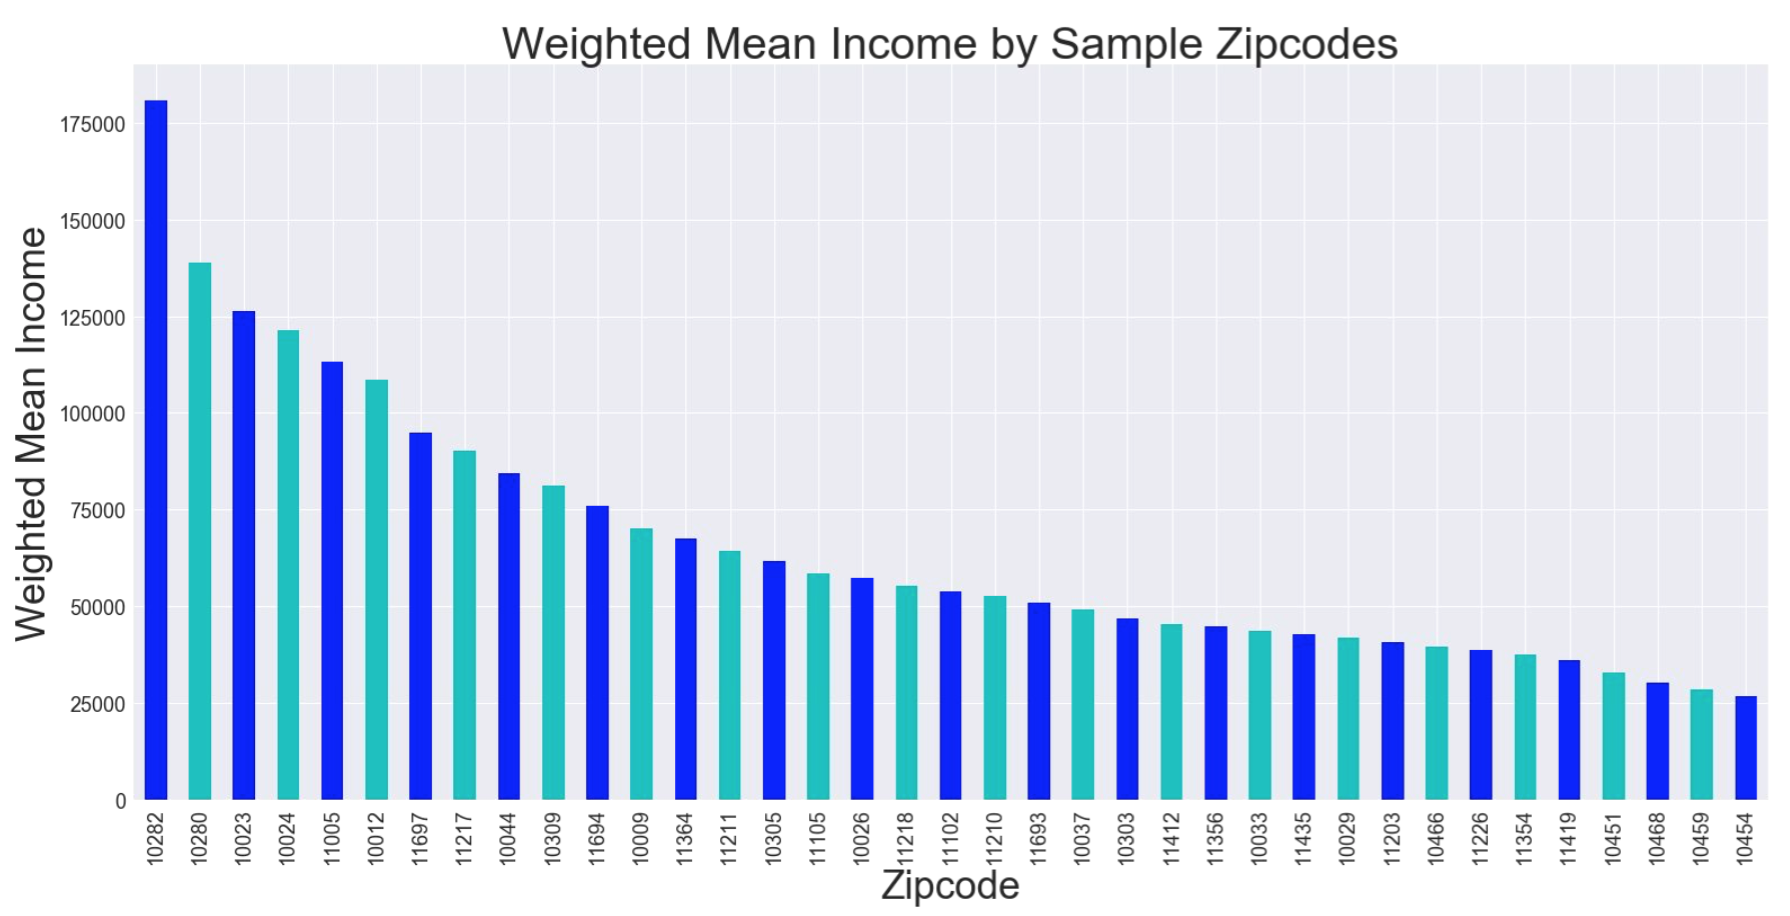
The weighted mean income varies a lot from region to region. Soho and Tribeca areas tend to be wealthier than other regions. In order to combine the income data with the traffic data, I picked the top 10 stations in terms of wealth and then sorted the stations by the size of traffic.
4. Conclusion
I used two main data sources to recommend the best stations for the Summer Gala promotion: 1)New York City MTA subway turnstile data and 2)New York State income distribution by zip codes. According to the brief analysis, the penn station has the most traffic for most time periods. However, the 86th street turned out to be the most crowded when the number of entrances is considered. In order to maximize the probability of gathering donations, I filtered the stations based on the mean income of the neighborhood and then selected the 5 busiest stations out of the candidates. According to the analysis, my top 5 recommendations are Chambers Street, Wall Street, Lexington Avenue, 51st Street, and Bowling Green.